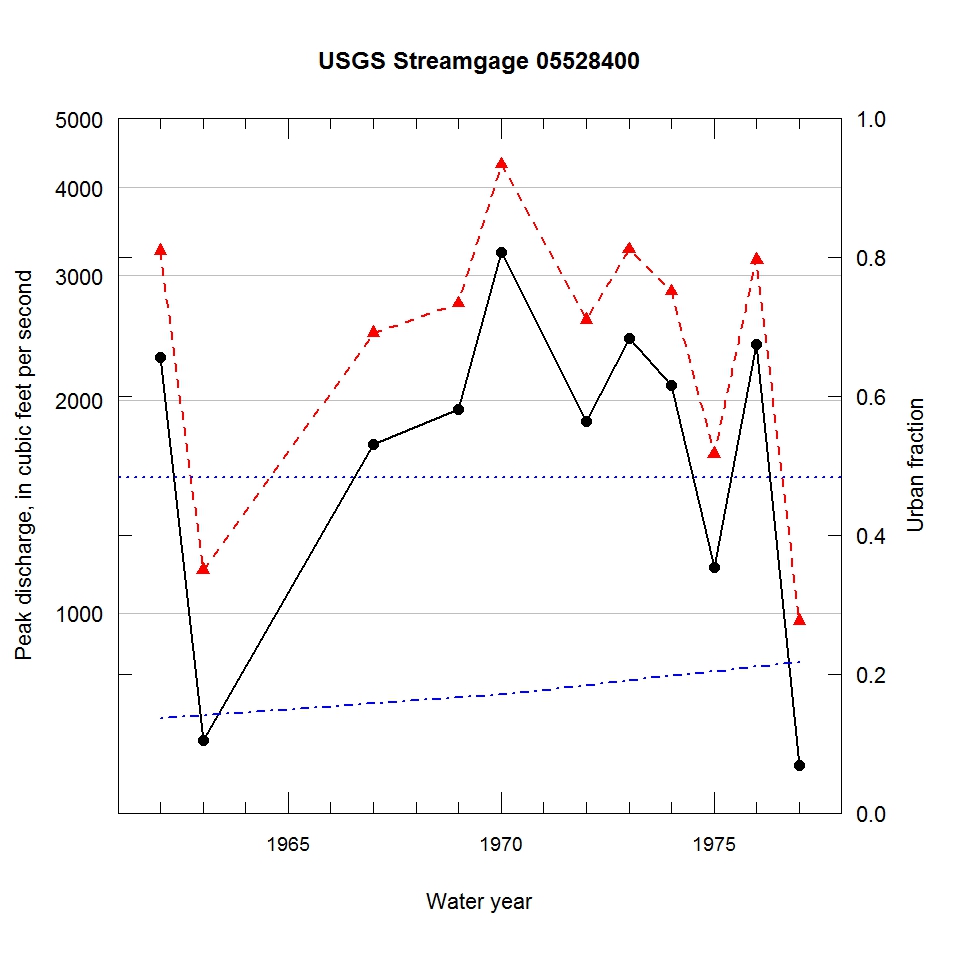
Observed and urbanization-adjusted annual maximum peak discharge and associated urban fraction and precipitation values at USGS streamgage:
05528400 DES PLAINES RIVER AT WHEELING, IL


| Water year | Segment | Discharge code | Cumulative reservoir storage (acre-feet) | Urban fraction | Precipitation (inches) | Observed peak discharge (ft3/s) | Adjusted peak discharge (ft3/s) | Exceedance probability |
| 1962 | 1 | -- | 7266 | 0.136 | 0.003 | 2300 | 3250 | 0.293 |
| 1963 | 1 | -- | 7266 | 0.140 | 1.412 | 660 | 1150 | 0.919 |
| 1967 | 1 | -- | 7483 | 0.158 | 0.774 | 1730 | 2490 | 0.509 |
| 1969 | 1 | -- | 7483 | 0.166 | 1.365 | 1940 | 2740 | 0.431 |
| 1970 | 1 | -- | 7483 | 0.171 | 1.659 | 3240 | 4310 | 0.133 |
| 1972 | 1 | -- | 8383 | 0.184 | 1.065 | 1870 | 2600 | 0.472 |
| 1973 | 1 | -- | 8383 | 0.191 | 1.392 | 2450 | 3270 | 0.287 |
| 1974 | 1 | -- | 8383 | 0.197 | 0.285 | 2100 | 2850 | 0.397 |
| 1975 | 1 | -- | 8383 | 0.204 | 0.873 | 1160 | 1680 | 0.784 |
| 1976 | 1 | -- | 8383 | 0.211 | 0.021 | 2400 | 3160 | 0.314 |
| 1977 | 1 | -- | 8383 | 0.217 | 0.825 | 610 | 975 | 0.946 |

